Transform your data with dynamic insights using TeBS AI Data Visualization Services.
In the fast-paced business world, the significance of data cannot be overestimated. Yet, it’s not just about having access to data, it’s about transforming it into actionable insights. Data visualization in AI helps businesses decode complex data landscapes through intuitive, compelling visuals that expose patterns and opportunities for strategic action.
Data Visualization AI refers to the integration of artificial intelligence techniques into data visualization processes.
It allows systems to automatically recognize patterns, detect anomalies, and suggest the most effective visuals for different datasets.
By combining AI and data visualization, organizations can move beyond static charts and graphs, enabling systems to think, learn, and visualize independently.
AI transforms traditional dashboards into intelligent decision-support systems, helping organizations uncover insights faster, automate analysis, and deliver meaningful business outcomes at scale.
Core Solutions
Data Visualization Services
Our comprehensive AI and data visualization services empower businesses to extract insights from complex data using smart, dynamic, and interactive visuals.


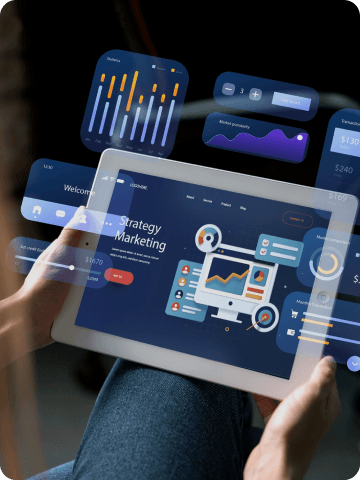
TeBS stands at the intersection of advanced analytics and AI innovation, delivering intelligent data visualization AI solutions tailored to your business context.
Proven Experience
01 Successfully implemented AI for data visualization across public sector, enterprise, and nonprofit clients.
Customized Solutions
02 We understand that no two businesses are alike—our solutions are built to align with your KPIs, user roles, and workflows.
End-to-End Execution
03 From data ingestion to visual storytelling, we manage the entire lifecycle using the best AI for data visualization platforms like Power BI, Synapse, and Azure OpenAI.
Continuous Innovation
04Our teams continuously explore new frontiers in AI and data visualization to help your organization stay ahead of the curve.
As a leading digital innovator, TeBS specializes in providing best-in-class data analytics services and AI solutions to enhance your data transformation journey.

Industry Expertise
Certified Technical Experts
Consultative Approach
Strategic Partnership

Interactive Dashboards
Craft dashboards that allow dynamic data exploration.
Rich Visualizations
Utilize diverse visuals to articulate your data story compellingly.
Real-Time Analytics
Gain insights instantly with real-time data analytics.
Natural Language Queries
Ask questions in your natural language and receive immediate answers.
Collaboration Tools
Share insights securely, enhancing team collaboration.
AI-Powered Insights
Leverage AI in data visualization to uncover hidden patterns and trends in your data.
TeBS integrates AI Data Visualizations to turn complex datasets into real-time, interactive dashboards that:
- Identify hidden patterns and anomalies
- Generate predictive visuals for proactive decisions
- Personalize data stories based on user roles
Our solutions go beyond traditional reporting by making your data contextually intelligent and instantly usable.
We bring:
- Certified Power BI experts and AI architects
- Proven project delivery across industries
- Custom dashboard development tailored to your KPIs
With AI in data visualization, we help clients evolve from static reports to intelligent visual decision systems.
Unlike traditional BI dashboards, data visualization in AI at TeBS leverages:
- Automated chart suggestions based on data context
- Smart anomaly detection and alerts
- Natural language interactions for non-technical users
This ensures quicker, deeper insights for users at every level.
Yes, our data visualisation AI models:
- Tailor narratives for specific departments or roles
- Contextualize visuals using user behavior and history
- Offer storytelling elements like smart annotations and predictive trends
This makes insights more relatable and decision-ready for all stakeholders.
Our AI for data visualization enhances UX by:
- Recommending visuals automatically
- Enabling conversational queries through NLP
- Updating dashboards in real time without manual effort
This democratizes data access and boosts adoption among business users.
TeBS empowers organizations to:
- Scale visual intelligence across departments
- Use AI to learn from usage patterns and improve visuals over time
- Share insights securely and collaboratively
Our AI Data Visualisation solutions evolve as your business grows.
We ensure successful implementation through:
- A consultative, KPI-driven approach
- End-to-end lifecycle management—from data ingestion to dashboard deployment
- Continuous innovation using the latest AI and data visualization tools
This results in sustainable, high-impact outcomes for your business.